
Power BI
Gain deeper insights into your data with Microsoft Power BI. This easy-to-use business analytics service connects with your data to provide interactive visualisations and valuable business intelligence – all in a unified, scalable platform. It helps you drive business productivity and enable smarter decision-making.
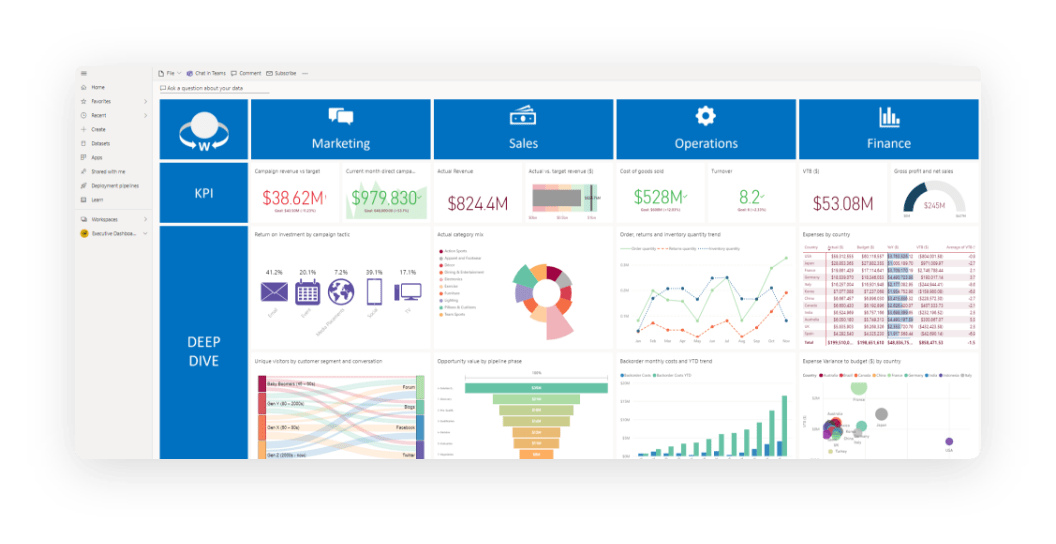
Power BI Actionable Insights:
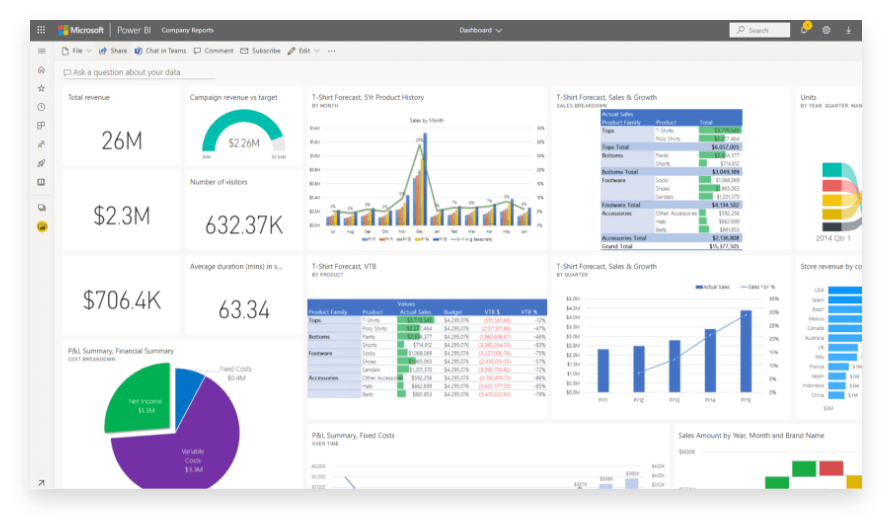
Sales Analytics
Enhance sales performance and strategy.
Power BI provides you with interactive data that helps you with everything from identifying and nurturing the most promising leads, to closing deals. Your business can maximise its data to build a data-driven culture, helping you achieve long-term sales success by generating sales pipeline and forecast reports for your team.
To help you understand and improve sales performance, Dynamics 365 analytics include:
• Top opportunities/sales people per quarter
• Sales cycle duration
• Lead and opportunity conversion rates
• Overdue opportunities
• Opportunities won/lost per month
• New opportunities per week
• Marketing campaign effectiveness, lead generation rates
• Sales pipeline and forecast reports by: month, quarter, year, salesperson, region, product & sales stage
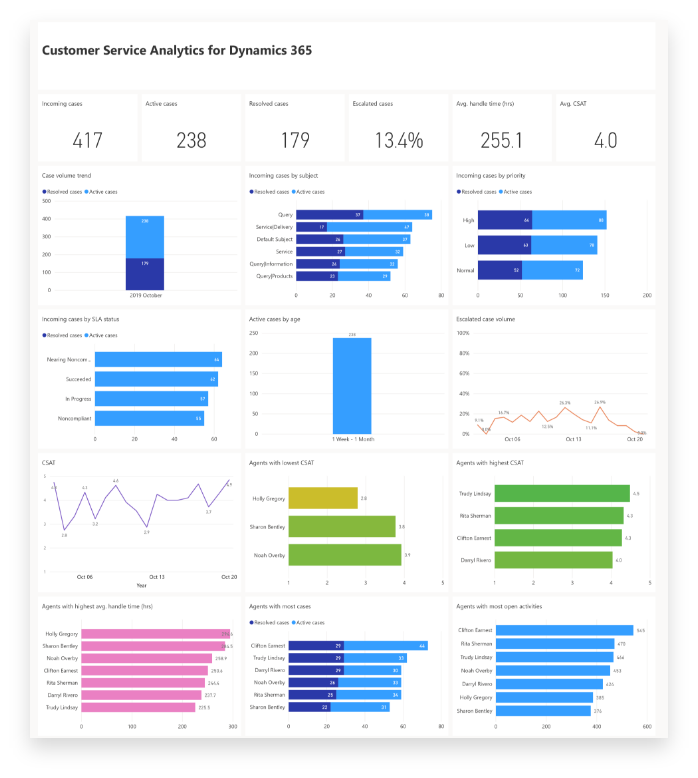
Customer Service Analytics
Maintain consistently high customer service satisfaction by giving your team a holistic view of each customer.
Use customer service dashboards and reports to track patterns and key performance indicators whilst ensuring each customer has their queries dealt with in an effective and personalised manner.
Power BI’s service dashboards and reports track trends including spikes and dips in service calls and complaints. Teams are measured against KPIs including:
• Customer satisfaction rates
• Case resolution times and average days open
• Open and overdue activities by owner, team, type, priority, account
• Service activities created in the current month vs last month
• Performance versus Service Level Agreement benchmark
• Contracts nearing expiry
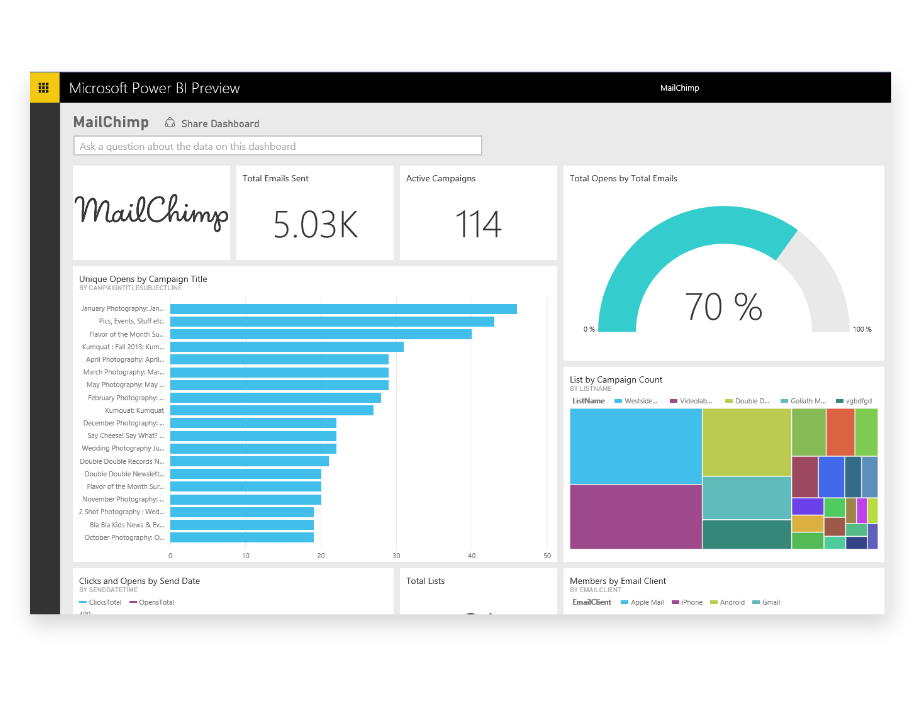
Marketing Analytics
Maximise your marketing capabilities with Power BI insights.
The marketing dashboards provide insights into the effectiveness of different campaigns. They can track lead conversions, campaign cost analysis, and ROI, and they can segment leads.
KPI’s include:
• Overall campaign effectiveness and ROI
• Campaign cost analysis and cost variance
• Most profitable/responsive market segments
• Number and value of leads/opportunities by campaign
• New leads per week/month
• Lead conversion per month
• Leads by owner, source, campaign, channel
• To access extended email marketing reports, integrate Dynamics 365 with ClickDimensions.
Empower your team with visualised data

Bring data to life Power BI makes it easy to connect to, model, and visualise your data. Create impactful reports you can personalise with your KPIs and brand. Ask it business questions in everyday language, and the service’s artificial intelligence will find your answers.

Get more from your big data investments Power BI connects to all your data sources. Maintaining data accuracy, consistency, and security, it can analyse, share, and promote insights throughout your organisation.

Improve decision-making Enable everyone throughout your organisation to make data-driven decisions quickly to drive strategic actions. With Power BI it’s easy for all of you to work together on the same data, collaborate on reports, and share insights via Microsoft Teams and Excel.

Protect data end-to-end Power BI safeguards your data across reports, dashboards, and data sets, even when you share them outside your organization or export them to other formats such as Excel, PowerPoint, and PDF.

Optimise Power BI’s power The service works best with other Microsoft technology – Azure and Office. Using them together will help you get the best possible value from your technology and data.

Connect everyone Want to give more of your colleagues a complete picture for data-driven decision making? You can: Microsoft provides you with a library of 120+ free connectors. Use these to connect directly to hundreds of on-premises and cloud data sources such as Dynamics 365, Azure SQL Database, Salesforce, Excel, and SharePoint.
Request a call back
Find out how your business can use the Power BI to advance its digital transformation. Use our easy booking system to get time with one of our team members.
Explore Our Other Microsoft Platforms and Apps
Find the right solution for your organisation:

Power Apps
Create the perfect ecosystem of Power Apps to support your business’ individual needs.

Power Automate
Create the perfect ecosystem of Power Apps to support your business’ individual needs.
Dynamics Integration

ClickDimensions
Empowering marketers to generate promising leads whilst nurturing and prioritising the best leads.
![]()
Sage
Connect your sales processes with Sage Accounts to streamline documentation and simplify internal communications.
![]()
Docusign
Securely send and receive order forms, sales quotes and other documentation with electronic signatures.

DCP
Provides you with the tools to generate and process professional documents efficiently, simplifying documentation requirements.
![]()
Xero
Execute effective marketing campaigns and access embedded analytics in one place.